
How many Albertans are filing for insolvency?
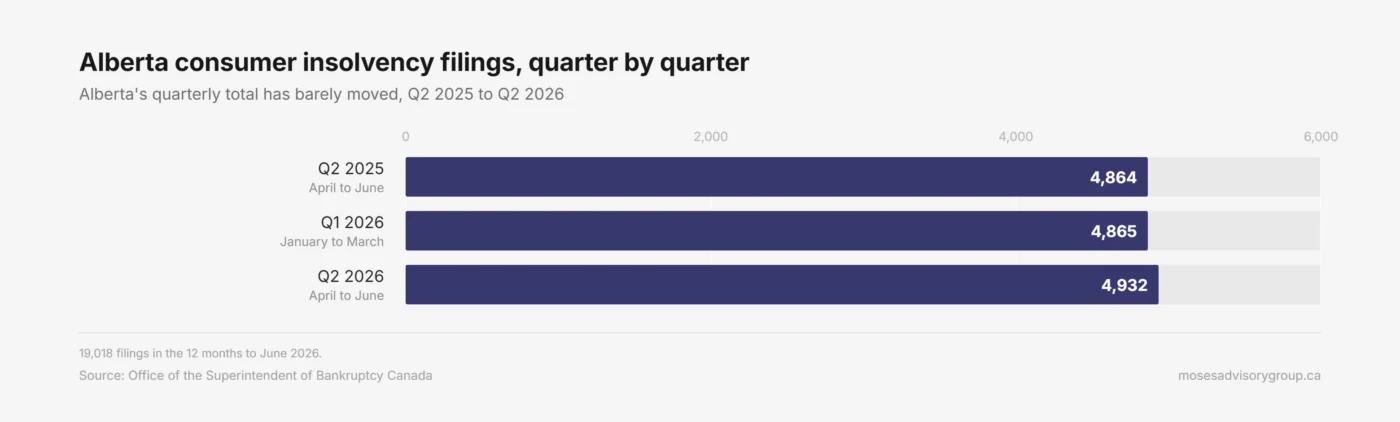
From April to June 2026, Alberta recorded 4,932 consumer insolvency filings, up 1.4% from the previous year. Canada overall saw a 6.9% increase in filings over the same period.
Alberta has not followed the national trend. Filing volumes here have stayed close to flat over the past year, while the national total has climbed.
Ontario’s consumer filings rose 10.2% year over year in Q2 2026, while British Columbia’s filings rose by 10.9%. In contrast, Alberta saw a smaller increase of 1.4%. Most of the national increase is coming from Ontario and British Columbia.
| Period | Alberta consumer insolvencies | Change from a year earlier |
|---|---|---|
| Q2 2026 (April to June) | 4,932 | +1.4% |
| Q1 2026 (January to March) | 4,865 | n/a |
| Q2 2025 (April to June) | 4,864 | n/a |
| 12 months ending June 30, 2026 | 19,018 | -0.7% |
Over the 12 months ending June 30, 2026, 19,018 Albertans filed for insolvency, down 0.7% from the previous 12-month period. This averages to about 52 people per day.
More bankruptcies, fewer consumer proposals
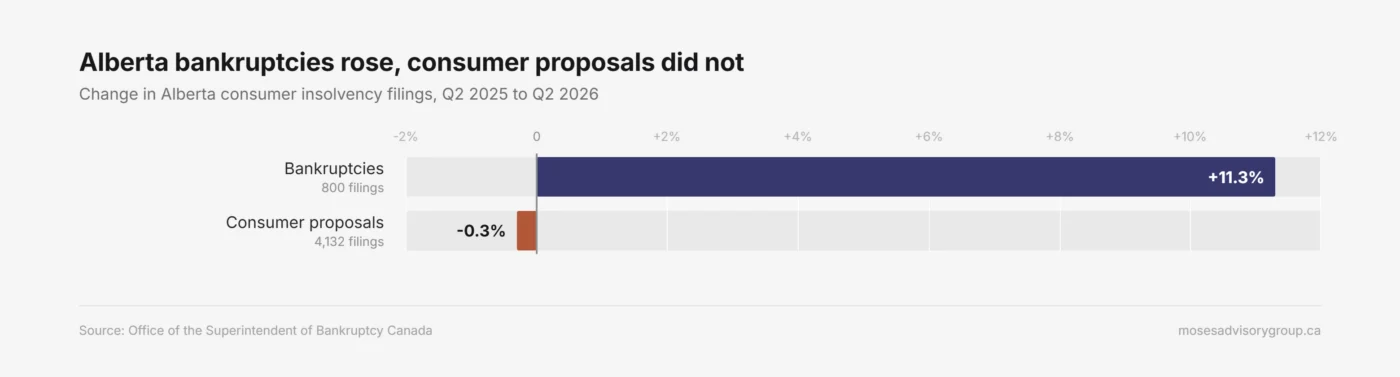
Alberta’s overall insolvency total barely moved, but the split between the two filing types shifted. Bankruptcies reached 800 in Q2 2026, up 11.3% from a year earlier and 7.8% from Q1.
| Filing type | Q2 2026 | Change from Q2 2025 | Change from Q1 2026 |
|---|---|---|---|
| Bankruptcies | 800 | +11.3% | +7.8% |
| Consumer proposals | 4,132 | -0.3% | +0.2% |
The two work differently. A consumer proposal is an offer to repay part of what you owe out of your monthly income. Bankruptcy is the other formal option under the Bankruptcy and Insolvency Act, when there isn’t enough monthly income to fund a consumer proposal.
A consumer proposal is contingent on income, meaning there must be some disposable cash remaining after paying all essential bills. If no extra funds are available, bankruptcy may become a more realistic option.
When bankruptcies rise and consumer proposals stay flat, it usually means people are arriving in a deeper financial position where they cannot commit to three to five years of structured repayments in a consumer proposal. At that point, bankruptcy is the only filing that clears the debt.
Robert Johnson, CPA, CA, CIRP, Licensed Insolvency Trustee
Consumer proposals still made up 83.8% of Alberta’s consumer filings in Q2 2026, one of the highest shares of any province.
Edmonton and Calgary
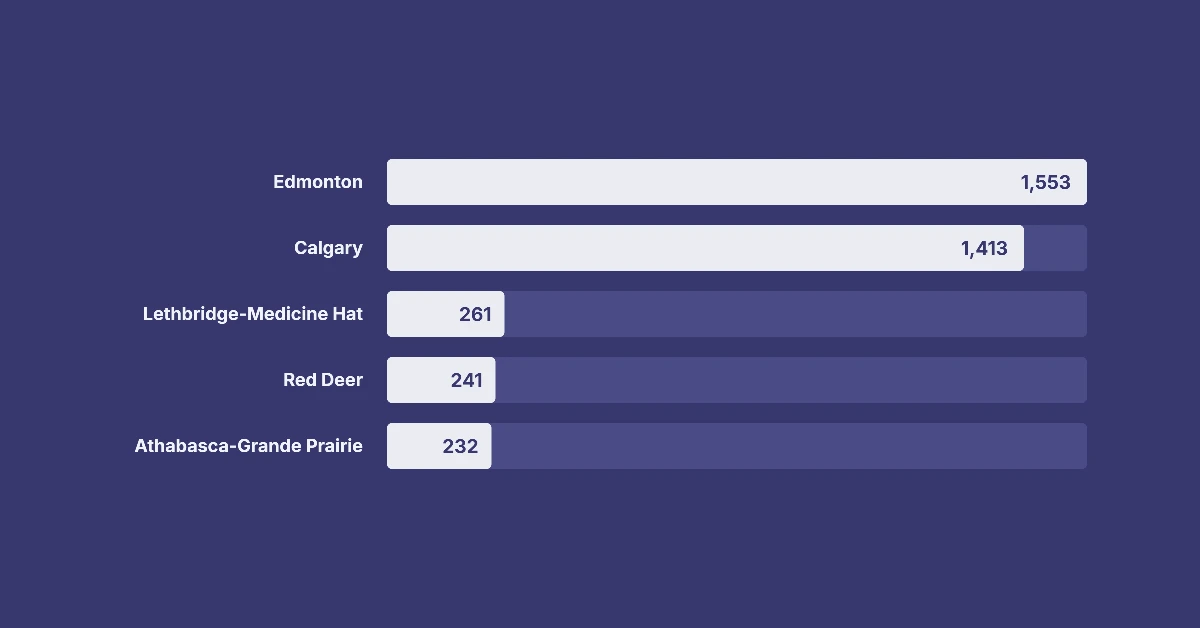
Edmonton consumer insolvencies fell 3.0% year over year, to 1,553 filings in Q2 2026. Calgary rose 1.7% to 1,413 filings.
Edmonton’s decline is more complex than it appears. Bankruptcies rose 2.5%, while proposals fell 4%, mirroring the provincial trend despite the overall reduction.
Over the 12 months ending June 30, 2026, Edmonton recorded 5,956 filings, down 6.3%.
Alberta consumer insolvencies by region, second quarter 2026
These figures represent filings in the April to June quarter, not the rolling 12 months. Consumer proposals outnumber bankruptcies in every region.
| Region | Total filings | Bankruptcies | Consumer proposals | Change from a year earlier |
|---|---|---|---|---|
| Edmonton | 1,553 | 250 | 1,303 | -3.0% |
| Calgary | 1,413 | 249 | 1,164 | +1.7% |
| Lethbridge-Medicine Hat | 261 | 44 | 217 | -16.1% |
| Red Deer | 241 | 48 | 193 | +7.1% |
| Athabasca-Grande Prairie-Peace River | 232 | 35 | 197 | +7.9% |
| Camrose-Drumheller | 170 | 34 | 136 | -2.3% |
| Wood Buffalo-Cold Lake | 165 | 24 | 141 | -19.5% |
| Banff-Jasper-Rocky Mountain House | 81 | 16 | 65 | +8.0% |
| Region not assigned | 816 | 100 | 716 | +21.6% |
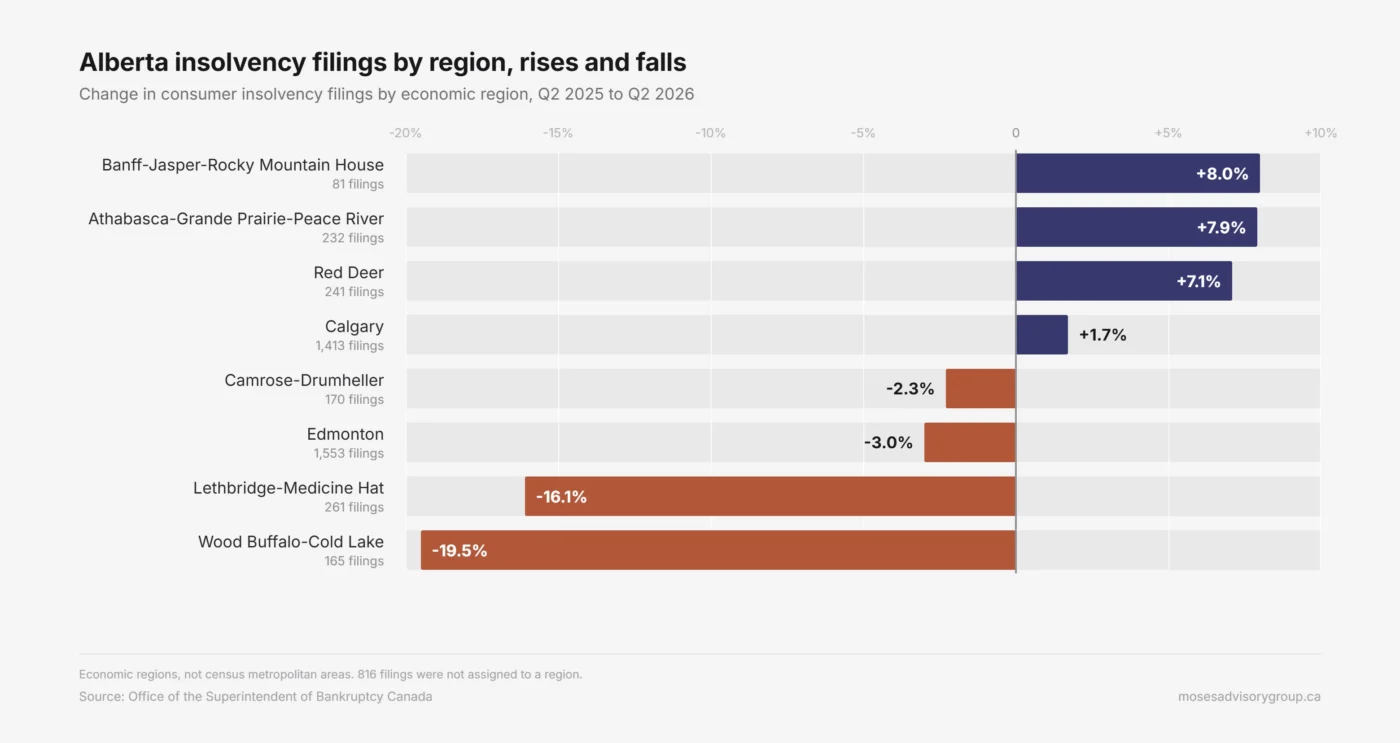
816 Alberta filings in the quarter were not assigned to a named region. The Office of the Superintendent of Bankruptcy reports them as unassigned to a region, so the actual numbers for Edmonton and Calgary are likely higher than shown in the table.
Alberta business insolvencies outpace the national trend
In the second quarter of 2026, Alberta business insolvencies increased to 99, up 35.6% from 73 a year earlier and 50% from the first quarter. Nationally, business filings barely moved, up 0.2%.
Business bankruptcies rose faster still, up 70.3% year over year to 63 filings. Corporate bankruptcies alone rose 93.3%, to 29.
However, treat each quarter carefully, as Alberta’s base is small. A few additional filings from a base of 99 result in large percentage swings. The 12-month total stands at 322 business insolvencies, up 5.2%, which is the more consistent figure.
What’s pushing Albertans toward bankruptcy
Rising construction costs, household affordability pressures, high non-mortgage debt, reduced refinancing options and weaker discretionary spending are collectively increasing financial strain across Alberta, particularly in regions built around resource development, tourism and hospitality.
Tariff-driven cost increases and elevated fuel prices are contributing to business insolvencies and restructurings. On the consumer side, we see people relying more heavily on credit as wages fail to keep pace with food, utility and fuel costs.
Alberta has the highest 90-plus-day non-mortgage delinquency rate in the country, at 2.45 percent against a national rate of 1.76 percent, according to Equifax Canada’s Market Pulse report for the second quarter of 2026. Households are facing growing pressure, especially as softer housing market conditions limit access to home equity refinancing, which previously served as a safe haven to avoid insolvency.
Methodology and sources
All figures presented here come from the Office of the Superintendent of Bankruptcy, the federal regulator that publishes quarterly insolvency statistics for each province. The statistics for Alberta focus exclusively on consumer filings. Business filings are excluded unless noted otherwise.
In Q2 2026, Canada recorded 37,523 consumer filings. This page uses that consumer-only figure, not the 38,804 all-filings total that also counts the 1,281 business insolvencies, so the two are never mixed.
Regional counts undercount because 16.5% of Alberta’s filings were not assigned to a region. City figures here come from the OSB’s economic region tables. The OSB also publishes a census metropolitan area table, where Edmonton shows 1,511 filings against the economic region’s 1,553.
No per-capita rates, because competing definitions are in circulation and Alberta’s Q2 rate could not be verified against the release. Volume figures only.
Alberta also has the Orderly Payment of Debts program, a provincial alternative administered by Money Mentors that allows full repayment of debts at 5% interest through a court order. OPD filings are not counted in the OSB’s federal statistics, so Alberta’s consumer proposal numbers may understate the full picture of structured debt repayment in the province.
The next OSB release is expected in mid-November 2026, and this page will be updated then.
Frequently asked questions
How many people filed for insolvency in Alberta in 2026?
In Alberta, 4,932 people filed for insolvency in Q2 2026, and 19,018 filed over the 12 months ending June 30, 2026. These figures include consumers only. The full calendar year total will be known once the OSB publishes its year-end data.
Are bankruptcies rising in Alberta?
Bankruptcies in Alberta are rising. In Q2 2026, consumer bankruptcies increased 11.3% year over year, totalling 800 filings. However, total insolvencies rose only 1.4% as proposals remained stable.
What share of Alberta insolvencies are consumer proposals?
In the second quarter of 2026, 83.8% of insolvencies in Alberta were consumer proposals, representing one of the highest proportions in any province. This amounts to 4,132 proposals compared to 800 bankruptcies.
Is Edmonton or Calgary seeing more insolvencies?
Edmonton reported 1,553 consumer insolvency filings in Q2 2026, compared to Calgary’s 1,413. Edmonton’s filings fell 3.0% while Calgary’s rose 1.7%. Both cities showed the same shift toward bankruptcy underneath, with bankruptcies rising and consumer proposals falling in each. These numbers don’t include filings not assigned to a specific region by the OSB.
Are business insolvencies in Alberta increasing?
Alberta business insolvencies rose 35.6% year over year in Q2 2026, to 99 filings, while nationally they barely moved at 0.2%. Due to the small number of filings, quarterly percentages can fluctuate significantly, making the 12-month increase of 5.2% a more reliable indicator.
What’s the difference between an economic region and a census metropolitan area?
An economic region covers a whole area including rural communities and small towns, while a census metropolitan area covers a city with an urban core of at least 100,000 residents. City figures on this page come from the OSB’s economic region tables. Edmonton had 1,553 filings in Q2 2026, compared to 1,511 in the Edmonton CMA.
When will these figures be updated next?
Alberta’s figures will be updated in mid-November 2026, when the OSB releases its third-quarter report.
Media inquiries
For an interview or background on these figures, email Robert Johnson at [email protected]
Reuse the charts and analysis
The charts and analysis on this page may be reused with credit and a link to this page.
Suggested attribution: “Office of the Superintendent of Bankruptcy data; analysis by Moses Advisory Group.” The underlying figures are published by the OSB.
It’s free to speak to a Licensed Insolvency Trustee
If you’re an Albertan facing overwhelming debt, a Licensed Insolvency Trustee can explain your options. The first consultation is free.